CHART OF OCTOBER 2012
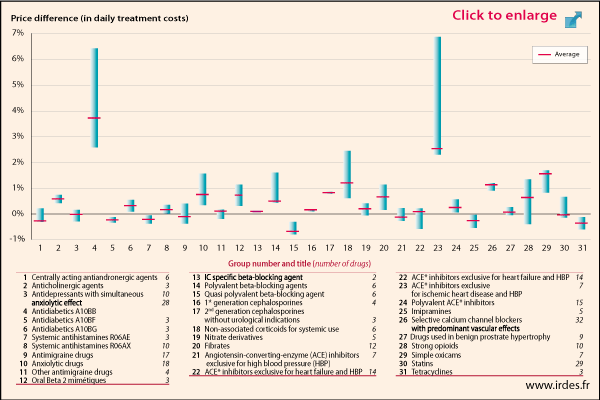
Price difference (expressed in daily treatment costs) between me-too drugs and first-in-class
according to their therapeutic class (France, 2009)
Reading guide: The graph makes it possible to observe the distribution and average price differences for 31 therapeutic classes (or groups). Each boxplot provides two types of information through its position with reference to the origin axis (o, position of the first-in-class drug) and its range.
Groups 4 and 23, for example, with wide boxes located very far from the origin axis are distinguished by high price disparities within the group and high average price difference between new entrants and the first-in-class.
Sources: Sempex [prices] and IMS Health Permanent survey on medical prescription (EPPM) [prescribed doses]. Calculations: IRDES.

